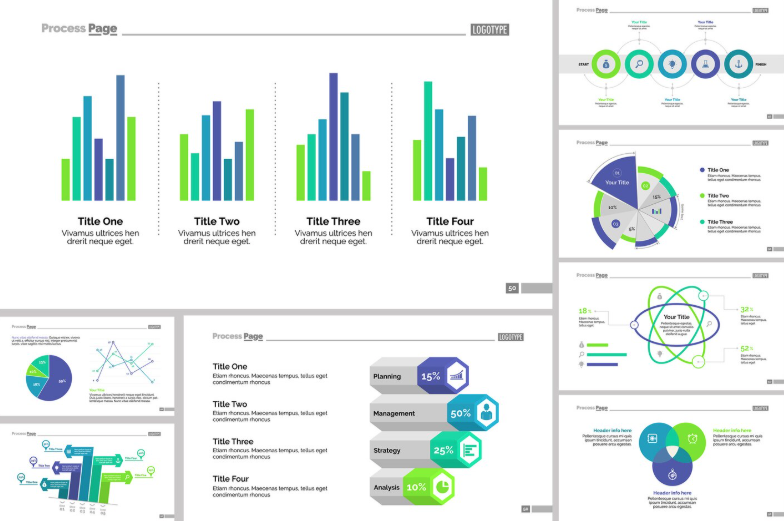
Data Visualization Templates Pack – Transform Data into Actionable Insights
Original price was: $7.00.$5.00Current price is: $5.00.
Description
Introduction
In a competitive digital landscape, presenting data clearly is just as important as collecting it. The Data Visualization Templates Pack is designed to help businesses, marketers, and analysts turn complex datasets into visually engaging and easy-to-understand reports.
Whether you’re tracking performance, analyzing trends, or presenting insights, this pack simplifies the entire process with ready-to-use templates.
What Is a Data Visualization Templates Pack?
A Data Visualization Templates Pack is a collection of professionally designed dashboards and charts created using tools like Microsoft Excel, Google Sheets, and other analytics platforms.
These templates help convert raw data into meaningful visuals such as graphs, charts, and dashboards—making decision-making faster and more effective.
Key Features
-
Pre-Built Visual Dashboards
Ready-to-use templates with modern and clean designs. -
Dynamic Charts & Graphs
Includes bar charts, line graphs, pie charts, and more. -
Fully Customizable
Adapt layouts, colors, and metrics to match your brand and business needs. -
Automated Data Updates
Built-in formulas ensure real-time data visualization. -
User-Friendly Interface
Easy to use for beginners and professionals alike.
What’s Included in the Pack?
1. Business Performance Dashboards
-
Revenue tracking
-
KPI monitoring
-
Growth analysis
2. Sales & Marketing Visuals
-
Campaign performance charts
-
Conversion tracking
-
Traffic and engagement reports
3. Financial Visualization Templates
-
Expense and income charts
-
Profit analysis dashboards
-
Budget tracking visuals
4. Project & Operations Dashboards
-
Task progress tracking
-
Resource allocation visuals
-
Timeline charts
Benefits of Using Visualization Templates
-
Simplify Complex Data
Convert raw numbers into clear visuals. -
Improve Communication
Present data effectively to clients and teams. -
Save Time
Avoid creating charts and dashboards from scratch. -
Enhance Decision-Making
Identify trends and insights quickly.
Who Should Use This Pack?
-
Business owners
-
Data analysts
-
Digital marketers
-
Agencies and freelancers
-
Project managers
How to Use the Templates
-
Choose a template based on your needs
-
Input or import your data
-
Customize charts and dashboard elements
-
Analyze visual insights
-
Share reports with your team or clients
Use Cases
-
Business performance reporting
-
Marketing analytics
-
Financial planning
-
Project tracking
-
Client reporting
Why Choose Our Data Visualization Templates Pack?
-
Professionally designed layouts
-
Compatible with Excel and Google Sheets
-
Easy customization for any industry
-
No coding or advanced skills required
-
Scalable for growing businesses
SEO & Business Advantages
Using data visualization templates helps businesses:
-
Improve reporting efficiency
-
Identify trends faster
-
Optimize marketing and sales strategies
-
Increase ROI through data-driven decisions
Related products
-
Sale!

Automated Excel Dashboard Templates – Boost Productivity with Smart Reporting
Original price was: $7.00.$5.00Current price is: $5.00. -
Sale!

Google Analytics Reporting Template (PDF + Sheet) – Simplify Data Tracking & Client Reporting
Original price was: $7.00.$5.00Current price is: $5.00. -
Sale!

Business KPI Tracking Dashboard – Monitor Performance & Drive Growth
Original price was: $7.00.$5.00Current price is: $5.00. -
Sale!
Sales Report Automation Toolkit – Streamline Reporting & Maximize Sales Performance
Original price was: $7.00.$5.00Current price is: $5.00.
Reviews
There are no reviews yet.